During the spring semester of her junior year, Julia Feller, an intern with the Office of Sustainability, worked for The Nature Conservancy in Missouri. There, she created the St. Louis EcoUrban Assessment, an interactive project that maps environmental racism in our region. Using ArcGIS technology, she compiled, processed, and analyzed environmental and demographic data, and made a StoryMap to convey where frontline communities are disproportionately affected by climate change and other related health risks.
By Julia Feller
The St. Louis EcoUrban Assessment grew out of requests from organizers and activists in the region seeking a centralized location for data on the impacts of environmental racism and the groups working to alleviate those harms. It serves as both a visual and interactive interpretation of data found in the Environmental Racism in St. Louis report (among other local research projects), and highlights place-based organizations that are best positioned to use the information for change. The team at The Nature Conservancy hopes it guides groups and individuals alike to build and fight for influential projects and policies.
The Assessment has two components: a narrative StoryMap and an interactive tool that organizations can embed onto their websites or articles. We chose the environmental indicators based on what local researchers have found to have the greatest impact on communities in St. Louis, along with places where nature-based solutions will have the greatest impacts.
The tool maps the communities who are most vulnerable to the effects of climate change and acknowledges the previous stewards of the land that make up the study region as well as the legacy of slavery in St. Louis. Communities that are majority people of color (POC) and low-to-moderate income (LMI) factor into every core question after environmental analysis in order to prioritize projects and allocation of resources that will most benefit at-risk populations.
The five core questions of the EcoUrban Assessment’s environmental analysis are as follows:
- Flood Risk: Where are frontline communities facing the highest risk of flooding?
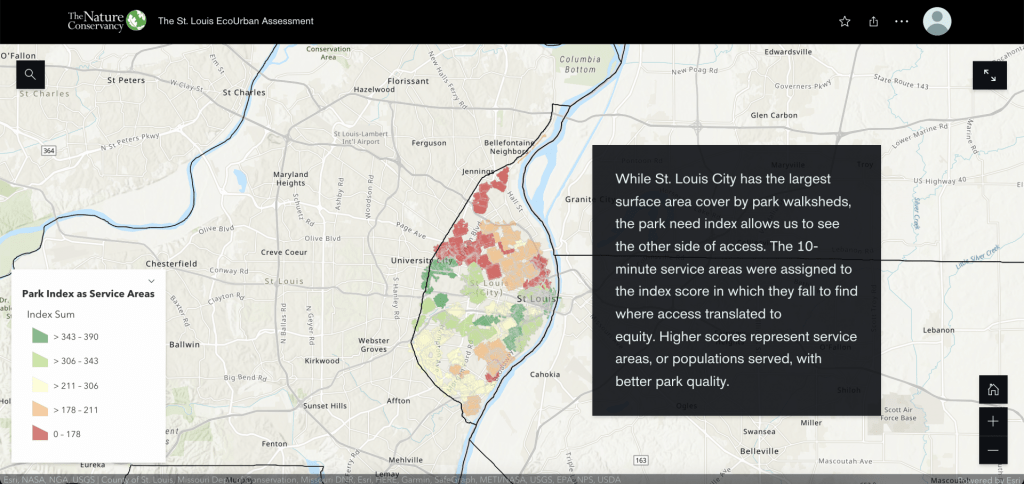
- Park Access and Quality: Which areas and which populations are best served by parks?
- Air Quality: Where are frontline communities facing the heaviest burdens of air pollution?
- Food Access: Where are frontline communities lacking access to healthy food?
- Vacancy: How do challenges posed by hyper-vacancy in St. Louis City inform other risks and solutions?
We analyzed each one of these questions differently to best represent the data. For example, the Assessment uses an intersection method to analyze air quality, where a handful of factors such as proximity to major roads, asthma rates, and tree
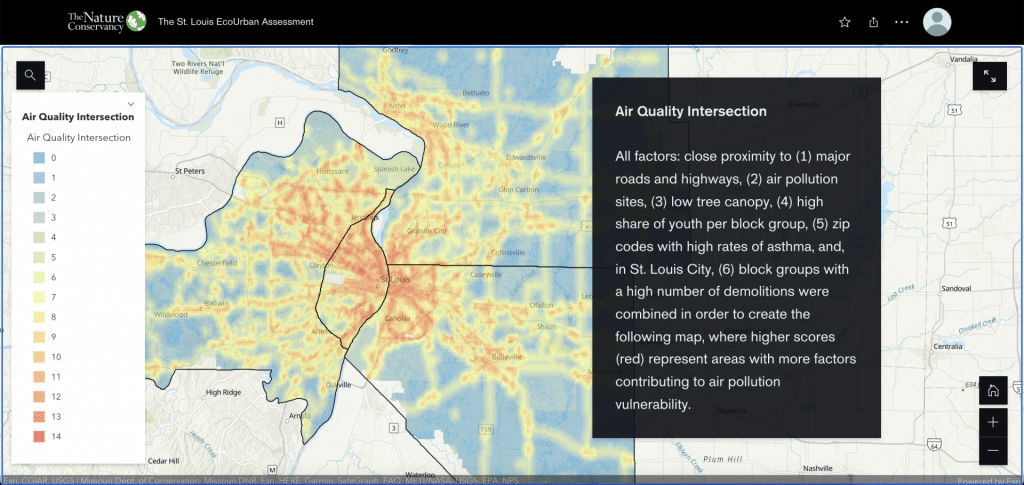
canopy were coded to represent areas of risk. These factors are combined to find where air pollution represents the highest risk and where populations are most affected based on a 15-point scale.
As for park access, we generated “service areas” around parks representing 10-minute walk times to find populations with direct access to green space. However, having access to parks alone does not necessarily imply the myriad benefits of open green space, and thus for St. Louis City we brought in a park quality measure incorporating
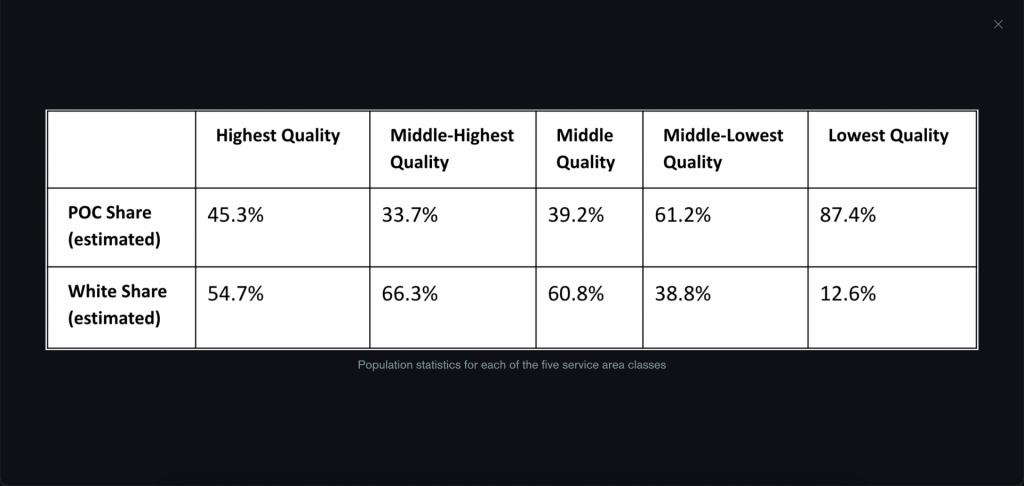
everything from amenities to maintenance to public transportation access. These scores were attached to service areas to link the populations with the parks themselves, so we could calculate the statistics for the proportions of white and POC communities in each grouping of parks.
There is almost a perfect linear relationship between race, ethnicity, and park quality—as a community becomes whiter and wealthier, the resources dedicated to parks increase, and vice versa. These types of findings outline just how systemic the issues of environmental injustice are in our region, and how solutions need to target the root problems that created these disparities.
To avoid the pitfalls of “challenge mapping,” or simply highlighting frontline communities without acknowledging possible solutions that could help to alleviate harm or what work is already underway, we collaborated with incredible local groups that organize communities and advocate for environmental and social justice every day. These community assets, such as Metropolitan Congregations United, Missouri Coalition for the Environment, the Saint Louis Vacancy Collaborative, SLACO, and Community Builders Network served as the backbone of the project, and their involvement is the most important piece of the tool.
A crucial component of the project is relationship building, with the organizations that are rooted in place and serving their own communities leading the way. Policy makers, funders, and external organizations like WashU should aim to build trust within the groups located in the most impacted neighborhoods to see how their resources can best align and help support the leadership that exists in that community. The interactive component allows users to view any combination of factors from the StoryMap, and overlay anchor institutions to identify where relationships can be built with the community to co-create solutions to local challenges.
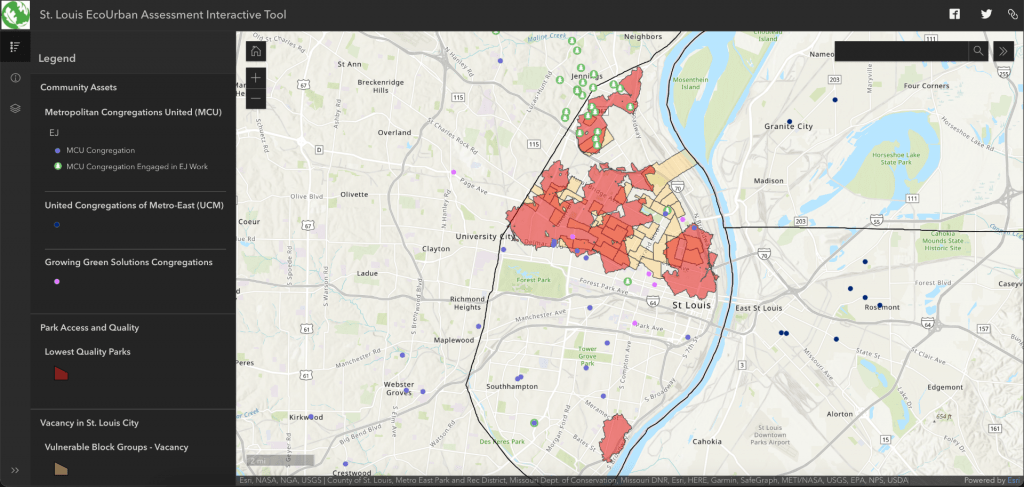
For example, users can select a map of network congregations along with areas representing the lowest quality parks and highest counts of vacant lots. This grouping could help a community locate where to rally around the creation of a new park on vacant lots, much like what the College Hill neighborhood is doing with Peace Park.
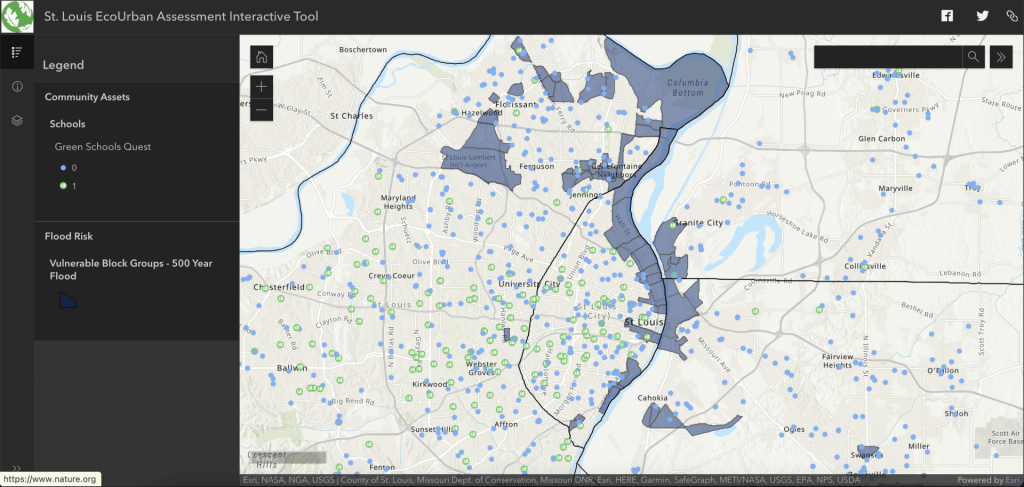
Or, users can view schools located in areas most vulnerable to 500-year flood events as a way to potentially locate green stormwater infrastructure investments. An example of these are green schoolyards, which help mitigate localized flooding issues and stormwater runoff, which The Nature Conservancy is helping build at Froebel Literacy Academy.
These examples are only the beginning—countless solutions could come from playing around with the tool and working with the organizations involved.
The St. Louis EcoUrban Assessment, borne from the collaborations between some of the brightest members of the St. Louis environmental justice community, will be most effective if utilized in direct partnership with those most impacted by these challenges. Sharing and gathering resources between a diverse variety of stakeholders in order to create solutions together will allow for the greatest changes to be made. Personally, I would like to guide WashU community members towards these organizations to directly impact the community in which we all live. I hope that WashU’s students, faculty, staff, and administrators will take notice of the tool and take advantage of the resources we have to actively promote environmental justice work in St. Louis.
If you have any questions or comments, please reach out to me at juliafeller@wustl.edu. To see a webinar in which I go through the project in more detail, please see the Office of Sustainability’s Event Recordings Page. A report with more detailed methodology and findings can be made available to interested parties by contacting Rebecca Weaver, The Nature Conservancy in Missouri’s Cities Program Manager, at rebecca.weaver@tnc.org.