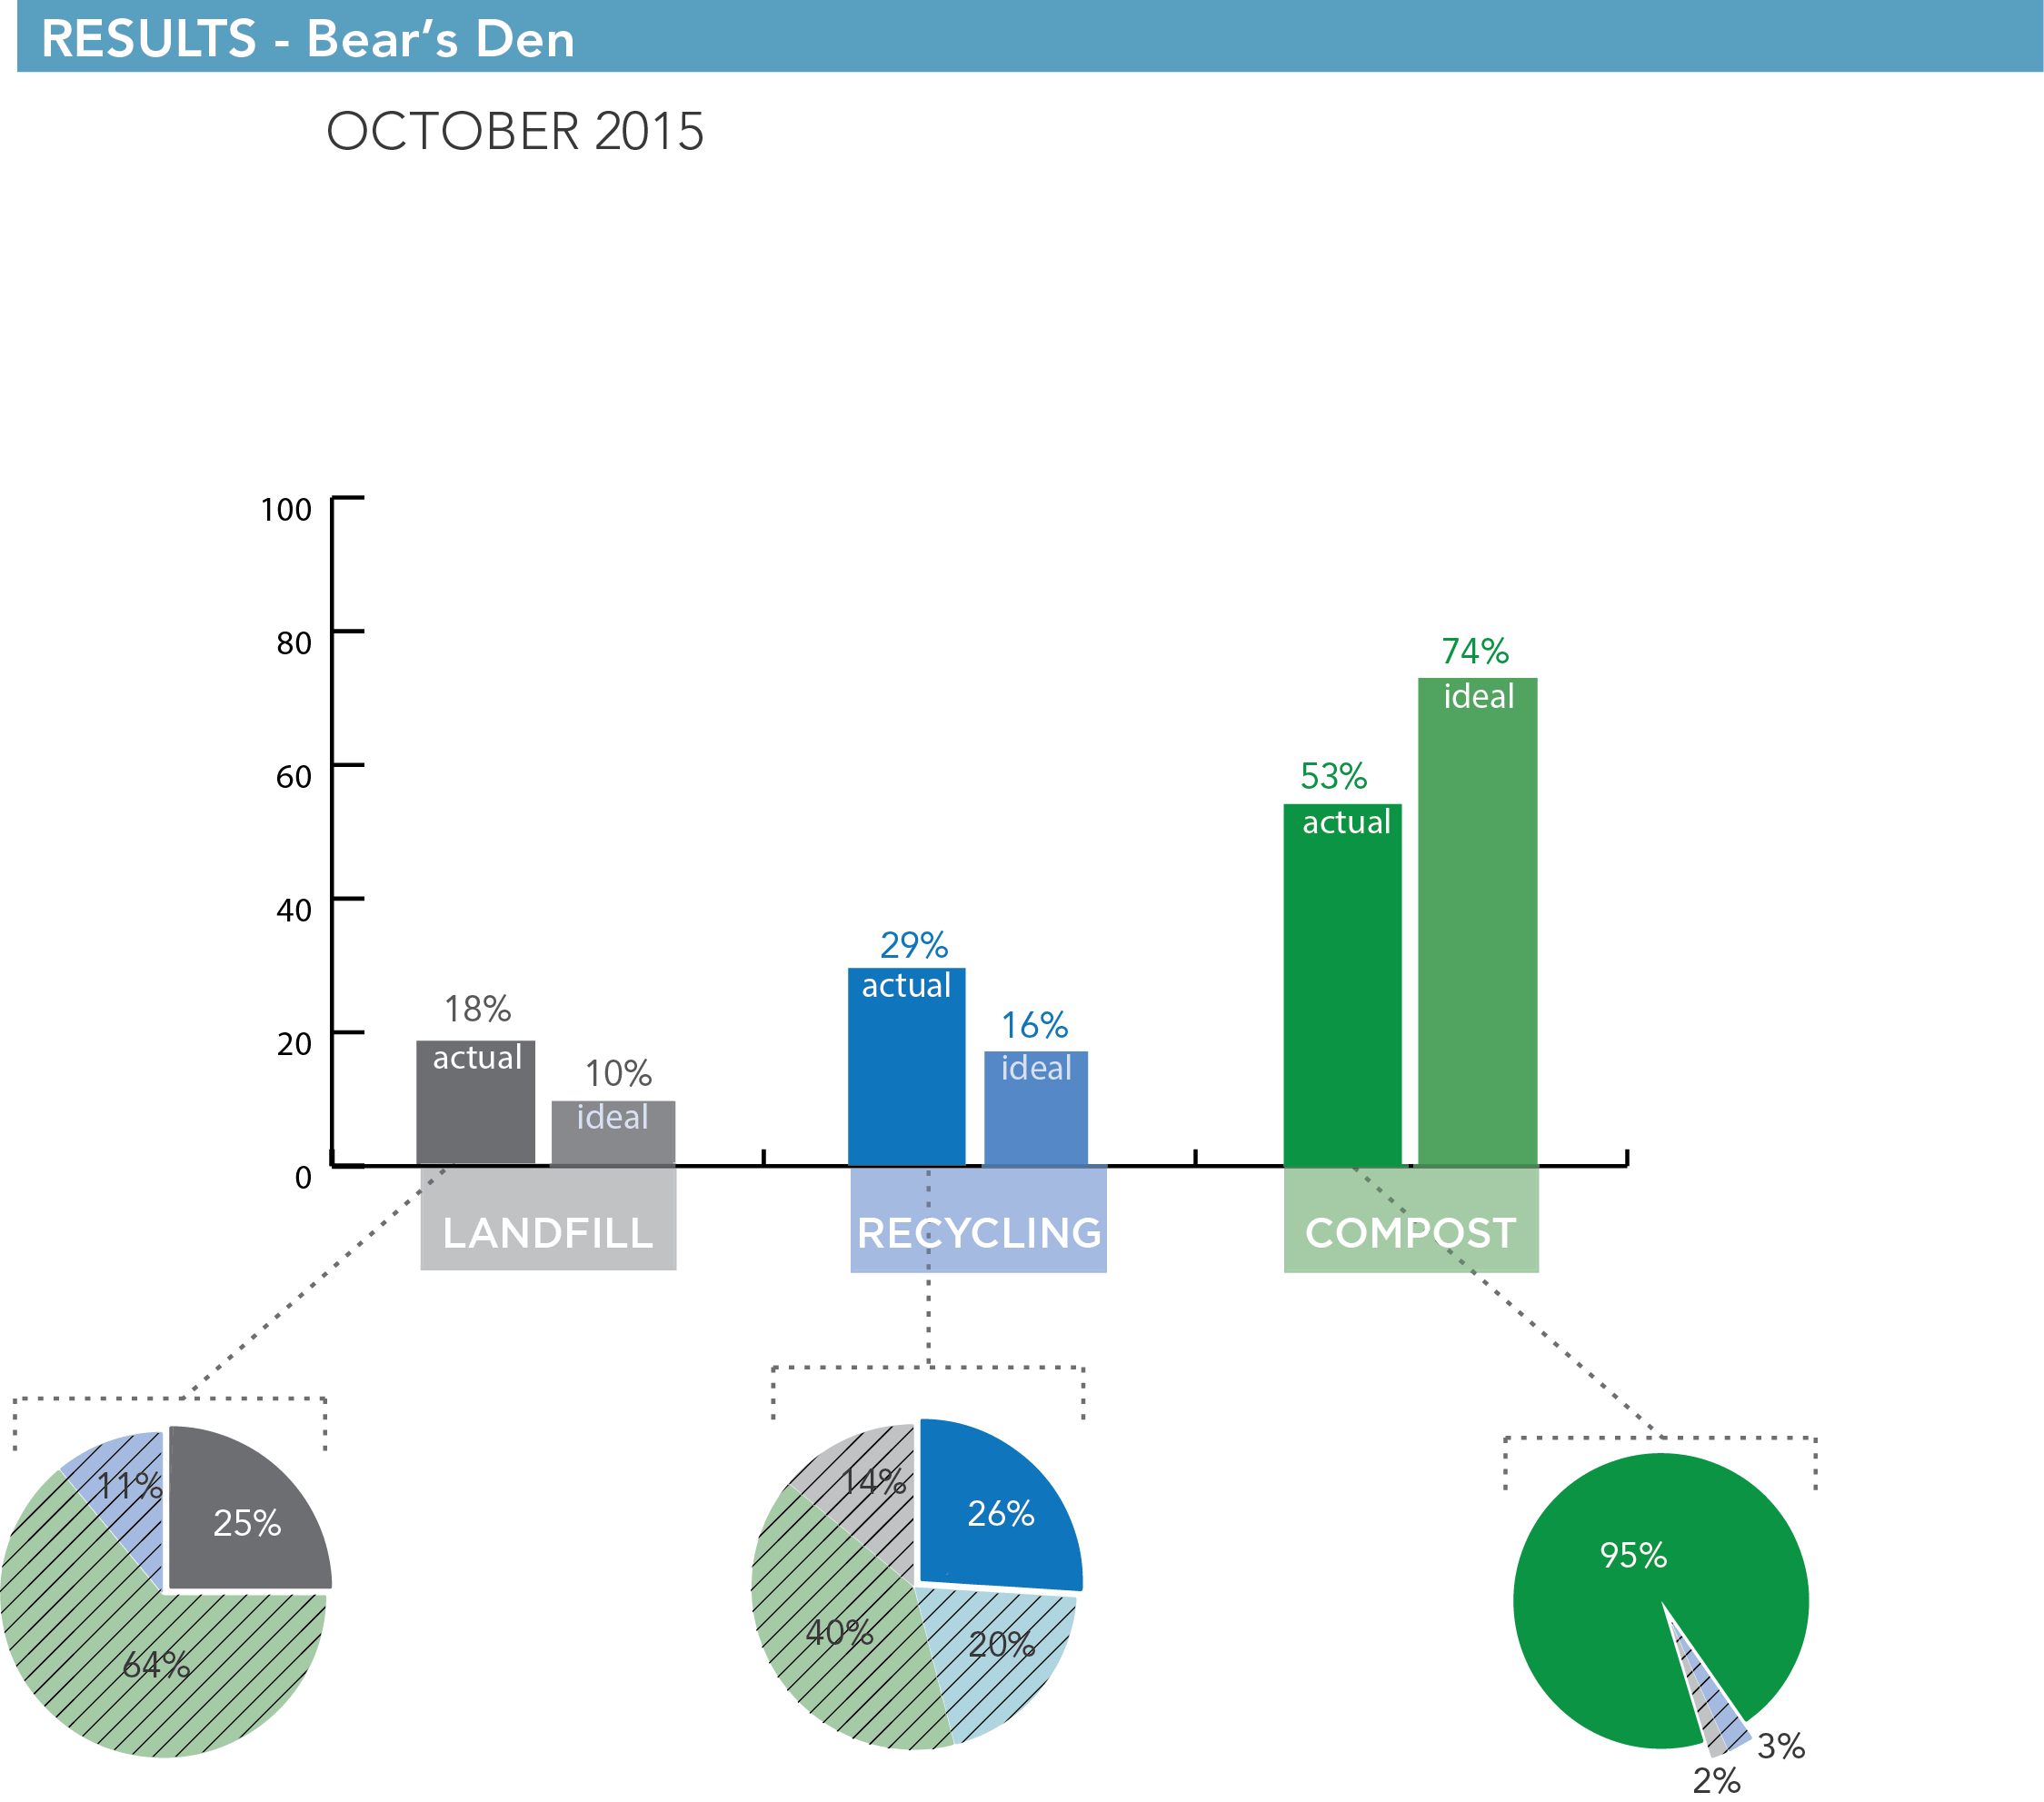
The data above is based on findings from a series of four waste audits conducted at the Bear’s Den in October. The Office of Sustainability conducts audits to assess how far consumer practices fall from ‘ideal’ waste sorting. When auditing, student interns and volunteers receive and sort pulls of all three waste streams (compost, recycling, and landfill), weighing the waste before and after the sorting process. This fall’s student team began the audits after Washington University Green Ambassador (WUGA) waste diversion outreach efforts ended at the beginning of September; thus, the broader student population had been sorting their waste at Bear’s Den without guidance for over a month.
The bar graph includes two bars for each waste stream. ‘Ideal’ represents what the percentages of a waste stream would be if perfectly sorted in Bear’s Den, while the other, marked ‘actual,’ is the percentage that students sorted into each waste stream. Connected to each ‘actual’ bar is a pie chart that shows the breakdown of what percentage each waste stream makes up for the bar. From these pie charts, the viewer can determine the different contamination rates in each stream. The pie chart for recycling also includes a light blue component. This constitutes the percentage of recycling that, while recyclable, would be better off being composted. This portion does not count as contamination to the recycling waste stream.
The results of the audit show that, with the help of the WUGA program, students averaged a contamination rate of 5% in the compost stream. This is a significant reduction from 2013, when a similar set of audits showed a roughly 9% contamination rate in compost. Landfill and recycling continue to have higher levels of contamination. Food in unsorted disposable boxes with mixed materials inside is the primary source of contamination by weight in both streams.
The Office of Sustainability will use these results to inform future outreach efforts and signage around waste diversion.
